
How to Read a Conversion Report Without Being Misled
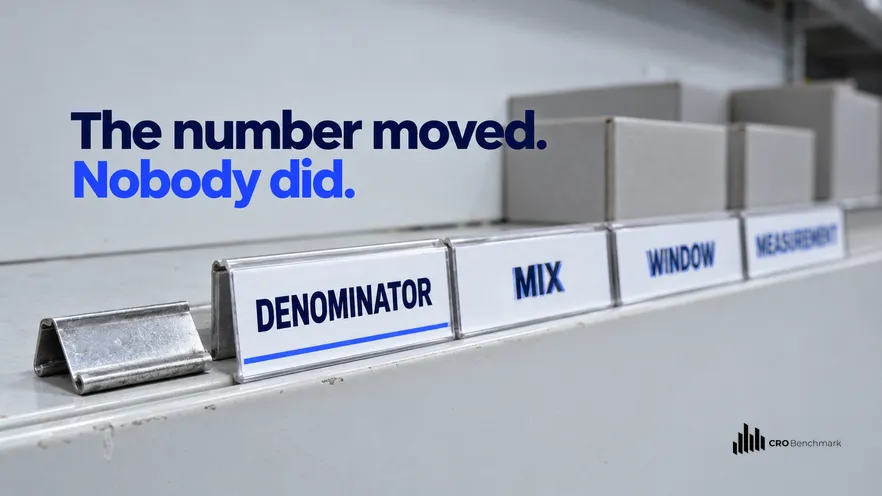
Mix shift is defined as a change in an aggregate rate caused by a change in the composition of the traffic behind it rather than by any change in behaviour, and it is the reason a conversion report can fall while every segment inside it improves. To read a conversion report safely, ask four questions of any movement: what the denominator counts, whether the mix changed, whether the window is a fair comparison, and what changed in the measurement itself. Around 70% of carts are abandoned across retail, a figure stable enough to make a sudden swing in your own rate suspicious [Baymard Institute, 2025]. This guide covers all four, with the signatures that give each one away.
- Ask what the denominator counts before interpreting any rate at all.
- Check the traffic mix: every segment can improve while the total falls.
- Compare like with like on window length, weekdays and promotions.
- Read the two or three biggest segments before reading the average.
- Treat a step change on a single date as a measurement change until proven otherwise.
- Act only on movements that survive all four questions and appear in segments.
Omniconvert has measured conversion behaviour across the CROBenchmark dataset of 7,000+ websites in 15+ industries, against 248+ audit criteria, over 13 years in eCommerce [CROBenchmark Report 2026, Omniconvert]. A recurring pattern in that work is a team confidently explaining a movement that turns out to have been a measurement change, and then building a quarter of work on the explanation.
The four questions to ask before you read a conversion report
The order matters a little. Denominator first, because if what counts as a session changed then nothing else in the report is comparable. Mix second, because it is the most common real cause. Window third, because it is the easiest to get wrong without noticing. Measurement last, because it is the one that needs somebody else's release log.
None of these is sophisticated statistics. They are bookkeeping questions, and the reason they go unasked is that a conversion rate looks like a fact rather than like a ratio with two sides, each of which can move on its own.
The level question, what a good rate even looks like, is answered separately in a good conversion rate. This piece is about whether the number in front of you means what it appears to mean.
The denominator is half the number and nobody looks at it
The signature is a step change on one date rather than a drift. Real behavioural change is almost always gradual, because the population changes gradually. A rate that moves four points overnight and then holds flat is a measurement event until somebody proves otherwise.
The usual culprits are mundane. A tag deployed to a new template, consent defaults changed in one market, a bot filter switched on, a session timeout adjusted, a redirect that splits one visit into two. Each of those changes what counts, not what happened.
Keep a dated log of every analytics and tag change, maintained by whoever makes them, and read it before explaining any movement. It is the cheapest control in the whole discipline and almost nobody keeps one.
Mix shift makes a true report misleading
This is the one worth internalising properly, because it is counterintuitive the first time and obvious afterwards. A store running a brand campaign brings in more top-of-funnel traffic, which converts at a lower rate than returning customers. Overall rate falls. Every cohort improved.
The same thing happens in reverse and is more dangerous, because it flatters. A quarter where paid spend is cut leaves a higher proportion of returning visitors, and the overall rate rises while the business shrinks. That one gets presented as a win.
The check is to compare the share of traffic by source, device and new-versus-returning against the previous period before looking at the rate. If the shares moved, the aggregate rate is not comparable and the segment rates are what you should be reading.
The specific way this plays out: a team celebrates a conversion-rate improvement in a month where media spend was paused for budget reasons, writes it up as the result of a checkout change shipped the same month, and then cannot reproduce it when spend resumes. The checkout change may well have been good. Nobody will ever know, because the mix moved at the same time and nothing recorded that.
Windows, comparisons and the promotion that was not controlled for
| Cause | Signature | The check |
|---|---|---|
| Denominator change | Step change on one date, then flat | Tag and analytics release log |
| Mix shift | Total moves, segments do not | Traffic shares by source and device |
| Unequal windows | Odd period lengths in the header | Same days, same length, same season |
| Promotion inside the period | One sharp week carrying the month | Overlay the promotion calendar |
| Segment collapse hidden by an average | Flat total, unhappy customers | Read the three biggest segments |
The last row is the quiet one. A flat overall rate can conceal one important segment falling sharply and another rising to match it, and a flat line attracts no attention at all. Reading the largest few segments every month costs minutes and catches it.
Unexpected cost and unclear information remain among the most persistent reasons people abandon a purchase, at around 70% average cart abandonment in the research Baymard Institute has run for years [Baymard Institute, 2025]. The stability of that figure across years is useful here: it means a sudden large swing in your own abandonment rate is far more likely to be measurement than behaviour.
AliveCor used Omniconvert to run a structured A/B testing programme and achieved +21% conversion rate, +5% revenue per visitor, and 94% statistical relevance across their experiments. [Omniconvert, AliveCor case study] The reason that result is quotable is the third figure. A number without a stated confidence is a story, and a programme that reports relevance alongside the uplift is one you can act on.
When a movement is real, and what to do then
Once a move is real, the next question is where it lives rather than how big it is. A fall concentrated in one device, one market or one traffic source points at something specific; a fall spread evenly across everything usually points back at measurement after all.
Then prove the fix rather than assuming it. Omniconvert Explore is the platform for that, and Explore is where a change to a shared surface such as the cart should be validated, because that surface pools the whole store's traffic.
Shopify's merchant guidance has pushed consistent measurement and product data across sales channels for years, and consistency is the underlying theme here too: a report is only comparable with itself if the definitions behind it held still. For the ranking of what to fix once you know, see how to benchmarks should shape your test roadmap, and for the audit method that produces the candidate list, audit it.
What to do this week
- Start a dated change log. Every analytics, tag and consent change, owned by whoever makes it. Read it first, every month.
- Add traffic shares to the report. Source, device and new versus returning, as shares, beside the rate. Mix shift becomes visible rather than inferred.
- Fix the comparison period. Same length, same weekdays, promotion calendar overlaid. Agree it once so nobody re-picks it each month.
Beyond the reporting hygiene, the structural move is to stop reading one number at all. Omniconvert Commander (formerly Nexus) is an AI for eCommerce growth engine that unifies commerce data, prioritises experiments by True Profit, and generates campaigns and creative you approve before they go live, which puts the segments and the profit behind them in the same view as the rate.
The nearest neighbour to this piece is combine benchmarks with customer research.
Frequently asked questions
How do you read a conversion report without being misled?
Ask four questions before interpreting any movement: what the denominator counts, whether the traffic mix changed, whether the window and the comparison are fair, and what changed in the measurement itself. Most unexplained moves in a conversion report are answered by one of those four, and none of them is about the store.
What is a mix shift and why does it matter so much?
A mix shift is a change in the composition of your traffic rather than in anyone behaviour. If a lower-converting source grows its share, the overall rate falls even when every individual segment improved. It is the single most common reason a report says something that is both true and completely misleading.
How do we know whether the denominator changed?
Read the release notes for your analytics tool and your own tag changes over the period. Session definitions, bot filtering and consent handling all change what counts, and all of them move a rate without anybody doing anything differently. A step change on a single date is the usual signature.
Is an average conversion rate ever useful?
As a monitoring signal, yes. As a basis for a decision, rarely. The average is a summary of several very different populations, and the decision you are about to make almost always applies to one of them. Read the segments, then use the average to check you have not missed something.
What period should we compare against?
The same length, the same days of the week, and ideally the same position relative to any promotion. Week-on-week comparisons that straddle a sale, a bank holiday or a release are not comparisons. Where the business is seasonal, the same period last year is more honest than the previous month.
When should we actually act on a movement?
When it survives all four questions and appears in the segments rather than only in the total. A move that disappears once you control for mix, window and measurement was never a change in behaviour, and acting on it means solving a problem your store does not have.
Four questions, ten minutes, every month
Before anyone explains a movement, check what the denominator counted, whether the traffic shares moved, whether the two periods are genuinely comparable, and what was released into the measurement during the window. Most of the moves that generate a meeting are answered by one of those four.
Then read the three largest segments before the average, and act only on what shows up in both. It is slower than reacting and considerably faster than spending a quarter on a problem the store never had.