
What Is a Good Conversion Rate, and How to Improve It
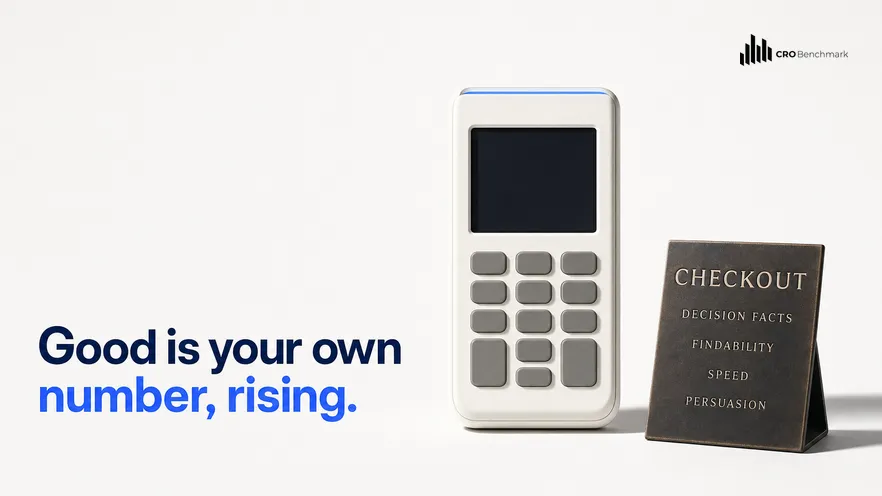
A good conversion rate is your own rate, rising against a stable traffic mix. Category averages are a sanity check, not a target, because the number is set mostly by what you sell, what it costs and where your visitors come from. The useful question is not whether you are above average but whether the trend is yours.
- A good conversion rate is your own rate, rising against a stable traffic mix.
- Category averages are a sanity check, not a target: price point and traffic source set the number.
- Comparisons fail three ways: the denominator moved, the definition drifted, or the window was too short.
- The Fix Ladder orders work by how much of the funnel each fix protects, starting at checkout.
- A gain is real only against a randomised control, over a full purchase cycle, read next to returns.
Almost every store asks what a good conversion rate is, and almost every answer supplies a percentage. The percentage is the least useful part. Two stores in the same category can sit two points apart with nothing wrong at either, because one sells a considered purchase to cold traffic and the other sells a repeat consumable to an email list. The number describes the business as much as the storefront. Last updated: August 2026.
Omniconvert has measured conversion behaviour across the CROBenchmark dataset of 7,000+ websites in 15+ industries, against 248+ audit criteria, over 13 years in eCommerce, and the most reliable pattern is not a benchmark at all. It is that stores with similar rates fail in completely different places, and that the ones which improve fastest are the ones that stopped comparing themselves outward and started reading their own funnel. If you do want the per-industry figures for a rough sanity check, our conversion rate benchmarks piece has them and this one will not repeat them. For the levers themselves in priority order, see how to improve your conversion rate.
What follows is the method instead: what makes a rate comparable, the three things that quietly break the comparison, the Fix Ladder that orders improvements by how much of the funnel they protect, and how to tell a real gain from a moved number.
What is a good conversion rate, really?
Start with why the averages disagree so wildly. A supplement bought monthly by a returning customer converts at a multiple of a mattress bought once a decade after four weeks of research. Neither store is better run. The purchase is different, so the rate is different, and averaging across both produces a figure that describes neither.
The same effect operates inside a single store. Paid social traffic to a new product converts far below branded search traffic to a bestseller, so a month of heavy prospecting mechanically lowers your rate while the underlying store is unchanged and your revenue may be up. Read that month as a conversion failure and you will optimise away the growth channel.
What is left once you strip out the things you do not control is a genuinely useful measure: your rate, on a fixed traffic mix, with a fixed definition of a converting session, tracked across comparable periods. That is a comparable conversion rate, and it is the only version of the number that reports on your work rather than on your circumstances.
The three things that break the comparison
Check these before drawing any conclusion from a change in the rate.
The denominator moved. Sessions are not a stable unit. A new channel, a seasonal shift, a device-mix change, a bot wave, an app update that fires extra sessions per visit: each changes the bottom of the fraction while the top is untouched. Before explaining a rate change, look at where the sessions came from. Most unexplained movements are explained here.
The definition drifted. Conversion means whatever your analytics says it means, and that quietly changes: a new subscription flow lands, a quote request starts counting, consent-mode changes alter what is recorded at all. Two periods measured under two definitions are not comparable, and nothing in the dashboard warns you.
The window was too short. A fortnight of data that ends before returns land will flatter any change which increased urgency. Baymard Institute’s long-running checkout research has documented how strongly clarity and friction shape purchase behaviour at exactly the moments a short window measures best, so a two-week win is a hypothesis rather than a result.
Read the funnel, not the blended rate
A blended conversion rate is a summary statistic, and summary statistics are designed to hide variation. That is useful for a board slide and useless for deciding what to do on Monday.
Break it into the steps a customer actually passes through: arrived, viewed a product, added to cart, began checkout, completed. Each transition has its own rate, and each is affected by different things. Falling out between arrival and product view is a findability problem. Falling out between product view and cart is a decision-facts problem. Falling out between cart and checkout start is usually a total-cost surprise, and Baymard Institute's research has consistently found unexpected extra costs to be among the most cited reasons shoppers abandon. Falling out inside checkout itself is almost always mechanical: an error, a form, a missing payment method.
Two things happen when a team does this for the first time. The obvious one is that the leak becomes visible, and it is frequently not where anyone was working. The less obvious one is that the argument changes character, because a step rate is specific enough to assign to an owner while a store-wide percentage is specific enough only to worry about.
Run the same split by device and by traffic source and the picture sharpens again. It is common to find a store whose desktop funnel is healthy at every step and whose mobile funnel collapses at one, which the blended number reports as a mild overall softness. That single finding regularly outweighs a quarter of copy testing, and it costs an afternoon in a tool you already pay for.
Record the step rates as your baseline before touching anything. They are the measurement the rest of this article depends on, and they are also the fastest way to tell later whether a fix worked, because a fix at one rung should move that rung's rate and leave the others roughly alone. When it moves everything, something else changed, and you are back to the denominator question.
The Fix Ladder: improving the rate in the right order
- Fix what stops a purchase completing. Checkout errors, forced account creation, a payment method your market expects and you do not offer, an address form that fails on a phone. These lose customers who had already chosen to buy you, which makes them the most expensive losses in the funnel and the fastest to recover. Walk your own checkout on a mid-range phone on mobile data before reading another report.
- Fix what stops a decision being made. Total cost including delivery, the delivery window itself, return terms, sizing, materials, compatibility. Publish them in text, on the page, before the cart. A shopper who cannot confirm a fact they need does not ask, they leave, and this is the rung where most stores have the largest gap between what they know and what they have written down.
- Fix what stops the product being found. Navigation, on-site search and filtering. A visitor who never reaches the right product is invisible to product-page optimisation, and on larger catalogues this rung frequently carries more lost revenue than the two above it.
- Fix what slows the page down. Load and interaction delay on your highest-traffic templates, measured on the devices your customers actually use rather than on a developer laptop. Speed is a real factor and it is also a popular first project, which is why it sits fourth: it rarely outweighs a broken checkout.
- Then test persuasion. Copy, layout, imagery, social proof, offer presentation. This is genuine conversion work and it produces attributable, repeatable gains, but only once the four rungs beneath it hold. Persuasion testing on a store with a failing checkout measures noise.
The ladder is deliberately unfashionable. Rungs one to four are maintenance, and maintenance does not present well in a strategy deck. It is also where the recoverable revenue sits on most storefronts, which is why the free CROBenchmark audit reads a site from the bottom of this ladder upward rather than starting with the copy.
| Rung | Who you lose | Time to recover | Usual team priority |
|---|---|---|---|
| Checkout and payment | Buyers who already decided | Immediate | Fourth or later |
| Decision facts | Buyers still deciding | Days | Rarely owned by anyone |
| Findability | Buyers who never arrived | Weeks | Treated as a redesign |
| Speed | Impatient buyers, unevenly | Weeks | Often first |
| Persuasion | Undecided buyers | A test cycle | Usually first |
| Redesign | Nobody, and possibly everybody | A quarter or two | The reflex answer |
The last row is included because it is the most common response to a disappointing conversion rate and the one least supported by evidence. A redesign changes everything at once, which means nothing in it can be attributed, and it frequently reintroduces problems from rungs one and two that had already been solved.
Telling a real gain from a moved number
Three checks, and they take minutes.
Was there a control? Randomised assignment is what separates a result from a coincidence, and before-and-after comparisons cannot supply it because the world changed too. This is the check that disqualifies most reported wins, including internal ones.
Did the window cover a purchase cycle? Long enough for returns to land and for a promotional period to end. A change that lifts conversion and raises returns has moved cost onto your warehouse.
Does it survive the neighbouring metrics? Read the rate beside average order value, return rate and repeat purchase. Bain and Company’s retention work holds that a five percent improvement in retention can raise profits by twenty-five to ninety-five percent, which is a useful reminder that the metric worth protecting sits downstream of the conversion you just optimised. A tested approach is what makes this readable at all: Omniconvert Explore is the CRO platform for that half, averaging a 23.2% conversion uplift across 70,000+ experiments precisely because those are controlled tests rather than before-and-after snapshots.
What a store owner should do this week
- Buy something from your own store on a mid-range phone. On mobile data, as a new customer, with a real card. Most teams discover a rung-one problem in the first attempt, and no report substitutes for this.
- Segment your rate by traffic source and device. One afternoon in analytics. The blended number almost always hides one segment doing badly and one doing fine, and the blend is what you have been reacting to.
- Write the missing decision facts for one template. Delivery window, total cost, return terms, sizing. In text, above the fold where possible. This is the cheapest rung-two fix available.
- Set a comparable baseline before you change anything. Fix the conversion definition, fix the segment, record the figure. Without it you cannot prove any of the above worked, and you will be asked.
Once the ladder is clear, the question moves from fixing leaks to choosing which experiments to run next, and that is where a wider view helps: the full growth system covers how conversion work, creative and visibility compound when run as one programme. To audit the ladder itself in order, our companion guide to the CRO audit checklist will audit it step by step.
What a better conversion rate will not fix
Three limits worth stating.
First, the offer sets the ceiling. If your price, delivery and returns are worse than the alternatives a shopper is actively comparing, a well-built store presents that comparison more clearly. Conversion work recovers the gap between your offer and its presentation. It does not close a gap in the offer itself.
First-time buyers are also not the whole picture. Marketing Metrics puts the probability of selling to an existing customer at roughly sixty to seventy percent against five to twenty percent for a new prospect, which means a store optimising only its acquisition funnel is working on the harder half of its own economics.
Second, the wrong traffic cannot be converted. A campaign attracting people who cannot afford the product produces a low rate that is a media problem wearing a CRO costume. Check the source before rebuilding the page, because the fix belongs to whoever is buying the traffic and no amount of storefront work will substitute for it.
Third, the rate can be pushed past the point of value. Aggressive urgency, heavy discounting and forced choices all raise conversion and all cost you somewhere else, usually in returns, margin or the second purchase. A store that wants the compounding version of this reads conversion beside those figures, and teams who want that read across the whole stack can see how Nexus by Omniconvert unifies commerce data and prioritises experiments by True Profit, with a human approving what goes live.
Related reading: your conversion rate is below benchmark.
The bottom line
Stop asking what a good conversion rate is in the abstract and start asking whether yours is comparable, then whether it is improving. Comparable means a fixed definition, a fixed segment and a window long enough to survive returns. Improving means measured against a control rather than against last month. Then work the Fix Ladder from the bottom: checkout, decision facts, findability, speed, and only then persuasion. That order is unglamorous and it is where the recoverable revenue actually sits on most storefronts. A store two points below its category average with a clean baseline and a working ladder will overtake one sitting on the average and arguing about the number.