
How Benchmarks Should Shape Your Test Roadmap
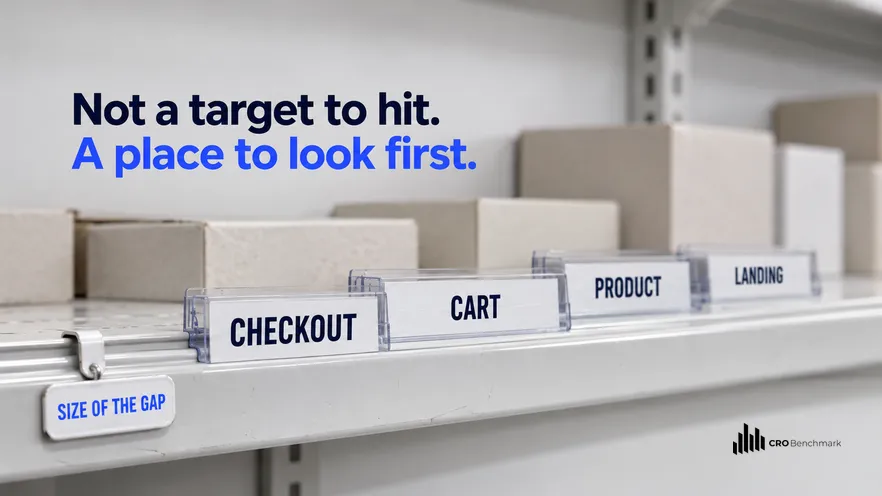
A benchmark gap is defined as the distance between one of your funnel metrics and the comparable figure for your category, and its only reliable use in a test roadmap is ranking where your headroom is largest. A benchmark is not a target, because part of every gap is explained by your price position, traffic mix and business model, which a test cannot change. The CROBenchmark dataset scores 7,000+ websites against 248+ audit criteria [CROBenchmark Report 2026, Omniconvert]. This guide shows how to turn those gaps into a ranked roadmap step by step.
- Use a benchmark to rank where your headroom is, not to set a target you owe anybody.
- Compare step by step, not your overall conversion rate against one headline figure.
- Convert each gap into revenue so gaps in different metrics become comparable.
- Discard gaps your positioning explains, because those are strategy, not opportunity.
- Rebuild the ranking quarterly, then leave it alone long enough for a test to finish.
Last updated: October 2026 · By The CROBenchmark Team
The useful job of a benchmark is sequencing. Omniconvert has built the CROBenchmark dataset over 13 years, scoring 7,000+ ecommerce sites against 248+ audit criteria, and the pattern that makes benchmarks actionable is comparing step by step rather than in aggregate, then ranking by the size of each gap in money. This guide covers why a benchmark is not a target, the four-step method for turning gaps into a roadmap, which gaps to throw away, and what to do when you are already ahead of your category.
Why a benchmark is a ranking signal, not a target
Think about what a category benchmark actually is: the central tendency of a population of stores that share a category with you and almost nothing else. Their price points differ, their traffic mix differs, their assortment depth differs, their returns policies differ. The figure is real and the population is not you.
So the gap between you and the benchmark has two components mixed together. One part is explained by structural facts about your business, which no test will change. The other part is unrealised room, which is what you are looking for. A target treats the whole gap as the second kind, commits the team to closing it, and produces either an unreachable goal or a strategic change nobody intended.
Used as a ranking signal, the same figure becomes much more reliable. You are no longer asking how far am I from the benchmark, you are asking which of my steps is furthest from its own benchmark. That comparison is internal, which cancels out most of the structural noise: whatever makes your store unusual applies to all your steps roughly equally, so the step with the biggest gap is genuinely your weakest link.
Measuring step by step rather than in aggregate
Your overall conversion rate is a single number produced by five or six multiplications. If it sits below the category figure, the only inference available is that at least one step underperforms, which you knew. Worse, two offsetting problems can cancel out and leave an aggregate that looks normal while both steps leak.
Break it apart instead: landing to collection, collection to product, product to cart, cart to checkout, checkout to purchase. Each has its own comparable figure and its own characteristic failure. If you want a view on where your overall position even sits before doing this, start with a good conversion rate for your category and treat it as the orientation rather than the finding.
The Gap Over Ceiling method for building a test roadmap
Call it Gap Over Ceiling, because the point is to find where your ceiling is highest rather than where your number is lowest.
Step one: measure every step against its own benchmark. Produce a table with one row per funnel step, your figure, the category figure, and the difference in percentage points. Keep it to one device segment at a time, or the rows stop being comparable.
Step two: convert each gap into revenue. This is the step that makes the method work. Multiply each gap by the traffic reaching that step and the value of a conversion. A four-point gap at a step reaching ten thousand visitors is worth vastly more than a twelve-point gap at a step reaching two hundred, and in percentage points the second one looks more urgent. Money is the only unit that makes gaps in different metrics comparable.
Step three: discard the gaps you cannot act on. For each remaining gap, ask what would have to be true for a test to close it. If the honest answer is that you would have to change your prices, your category mix, your traffic sources or your returns policy, cross it out. A premium brand sitting below the category conversion benchmark and above it on order value is not underperforming; it is correctly executing a different strategy. Deleting these is the step teams skip, and it is the one that stops a roadmap full of tests aimed at the business model.
Step four: order what remains by gap, not by metric. Sequence the roadmap by the revenue figures from step two. This routinely produces an order that surprises people, because the metric everyone has been discussing in meetings is often third or fourth once the arithmetic is done.
Which gaps to keep and which to throw away
The last column is the test. If a gap's explanation is a decision you stand behind, the gap is not work.
| Gap | Usually means | Keep or discard |
|---|---|---|
| Cart to checkout below benchmark | Unexpected costs or friction at the cart | Keep: almost always closeable |
| Product to cart below benchmark | Missing information or weak product pages | Keep: closeable with page work |
| Checkout to purchase below benchmark | Form friction, payment options, or a required account | Keep: often the cheapest fix available |
| Landing step below benchmark on paid traffic | Message mismatch between ad and page | Keep, but the fix may be in the ad |
| Overall conversion below benchmark, premium pricing | Your price position, working as intended | Discard: check order value instead |
| Conversion below benchmark, mostly cold paid traffic | Your acquisition mix rather than your site | Discard at site level, keep as a channel question |
The last two rows are where roadmaps go wrong most often, because both produce a real gap against the category and neither is a site problem. A quarter spent testing product pages to close a gap caused by cold traffic mix will produce small, honest, disappointing results, and the team will conclude that testing does not work.
What to do this week
In order:
- Build the one-row-per-step table for your main device segment, over a quarter of data rather than a month.
- Convert every gap into revenue using traffic at that step and the value of a conversion. Expect the order to change.
- Strike out every gap whose only explanation is a decision you stand behind. Be strict: this is the step that saves a quarter.
- Take the top remaining gap and decide whether it is a quick fix or a long bet, which is a different question from how big it is. CRO quick wins vs Long-Term bets is the distinction to apply here.
- Run a free audit against the CROBenchmark dataset to get the page-level findings behind the step you chose, since a gap at a step does not tell you which element causes it.
- Where you want the manual version of that page-level work, audit it yourself with the full checklist.
One note for teams already above their category on every step. Benchmarks have given you what they can, and your own history is now the reference: compare each step to its best sustained figure over the past year and sequence by distance from your own peak. The Baymard Institute's published research remains useful at that point for hypotheses rather than targets, and Statista's category data is worth a sense check on whether your category benchmark itself has moved. Beyond that, the remaining opportunity is specific to your store, and the handover from a ranked gap to a shipped change is where the time goes. Omniconvert Commander (formerly Nexus) is an AI for eCommerce growth engine that unifies commerce data, prioritises experiments by True Profit, and generates campaigns and creative you approve before they go live, which is that handover treated as a product rather than a gap in the process.
Teams often take the biggest gap on a benchmark slide straight into the roadmap. The gap turns out to be a pricing or business-model choice, no test can close it, and a quarter of test capacity goes on a question that was settled before the test began.
AliveCor used Omniconvert to run a structured A/B testing programme and achieved +21% conversion rate, +5% revenue per visitor, and 94% statistical relevance across their experiments. [Omniconvert, AliveCor case study] Choosing which gap to test first is where a programme like that earns or wastes its capacity.
Frequently asked questions
How should benchmarks shape a test roadmap?
By ranking where your headroom is largest, not by setting targets. A benchmark tells you that stores like yours achieve a certain figure at a certain step, which makes the distance between you and that figure an estimate of how much a fix could be worth. Sequence the roadmap by the size of those gaps converted into revenue, and the biggest opportunity goes first rather than the most discussed metric.
Why is a benchmark not a target?
Because a benchmark describes other stores, and some of the distance between you and them is explained by things you will not change: your price position, your category mix, your traffic sources, your business model. Treating the figure as a target commits you to closing gaps that are not closeable. Treating it as a ranking signal uses the only information it reliably carries, which is where the headroom is.
Which benchmark gaps should you ignore?
Any gap that a structural fact about your business explains. A premium brand will sit below the category conversion benchmark and above it on order value, and both are consequences of the positioning rather than problems. A store with heavy cold paid traffic will show a worse landing step than one living on branded search. Those are explanations, and a test aimed at one of them is a test aimed at your own strategy.
What if you are already above the benchmark everywhere?
Then benchmarks have stopped being useful to you and your own history becomes the reference. Compare each step against its best sustained figure over the past year rather than against the category, and sequence by the distance from your own peak. Being above the category average means the remaining opportunity is specific to your store, which means only your own data can locate it.
How often should the roadmap be rebuilt from benchmarks?
Quarterly is enough, and more often is counterproductive. Benchmarks move slowly, your funnel moves when you ship, and a roadmap rebuilt monthly never lets a test finish. The useful cadence is to re-measure the gaps each quarter, re-rank, and then leave the sequence alone while the top one or two are tested properly.
The bottom line
Stop comparing your overall conversion rate to a category average, because that comparison cannot tell you what to do. Build the step-by-step table instead, convert every gap into money so the metrics become comparable, and then do the part almost nobody does: strike out every gap that your own pricing, positioning or traffic mix explains. What survives is a short, honest, ranked list of places where your ceiling is genuinely higher than your floor, and the top item on it is your next test.