The data behind eCommerce conversion in 2025
The largest AI-powered eCommerce conversion infrastructure audit to date. 7,000+ stores. 300+ criteria. 65 countries. Built on 13 years of Omniconvert expertise.
Ready to use for journalists & podcast producers
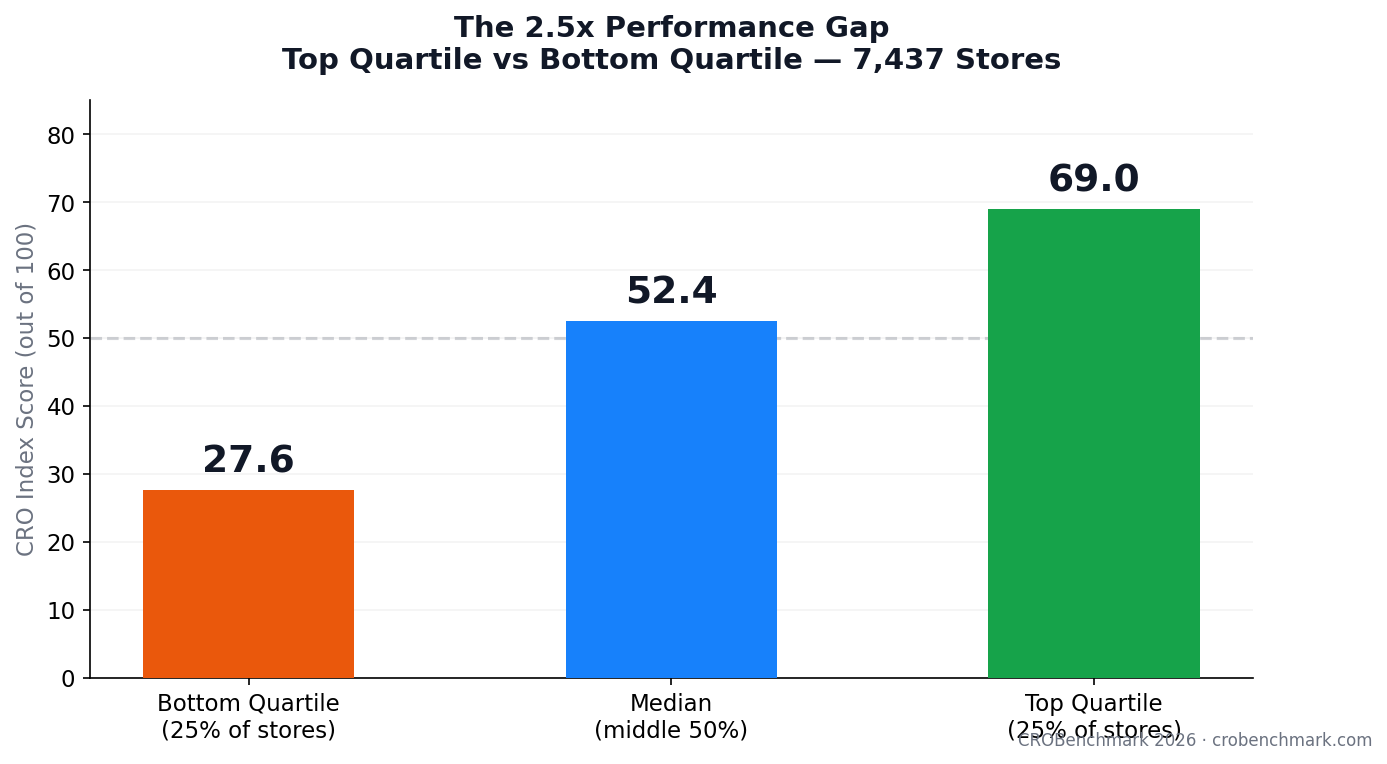
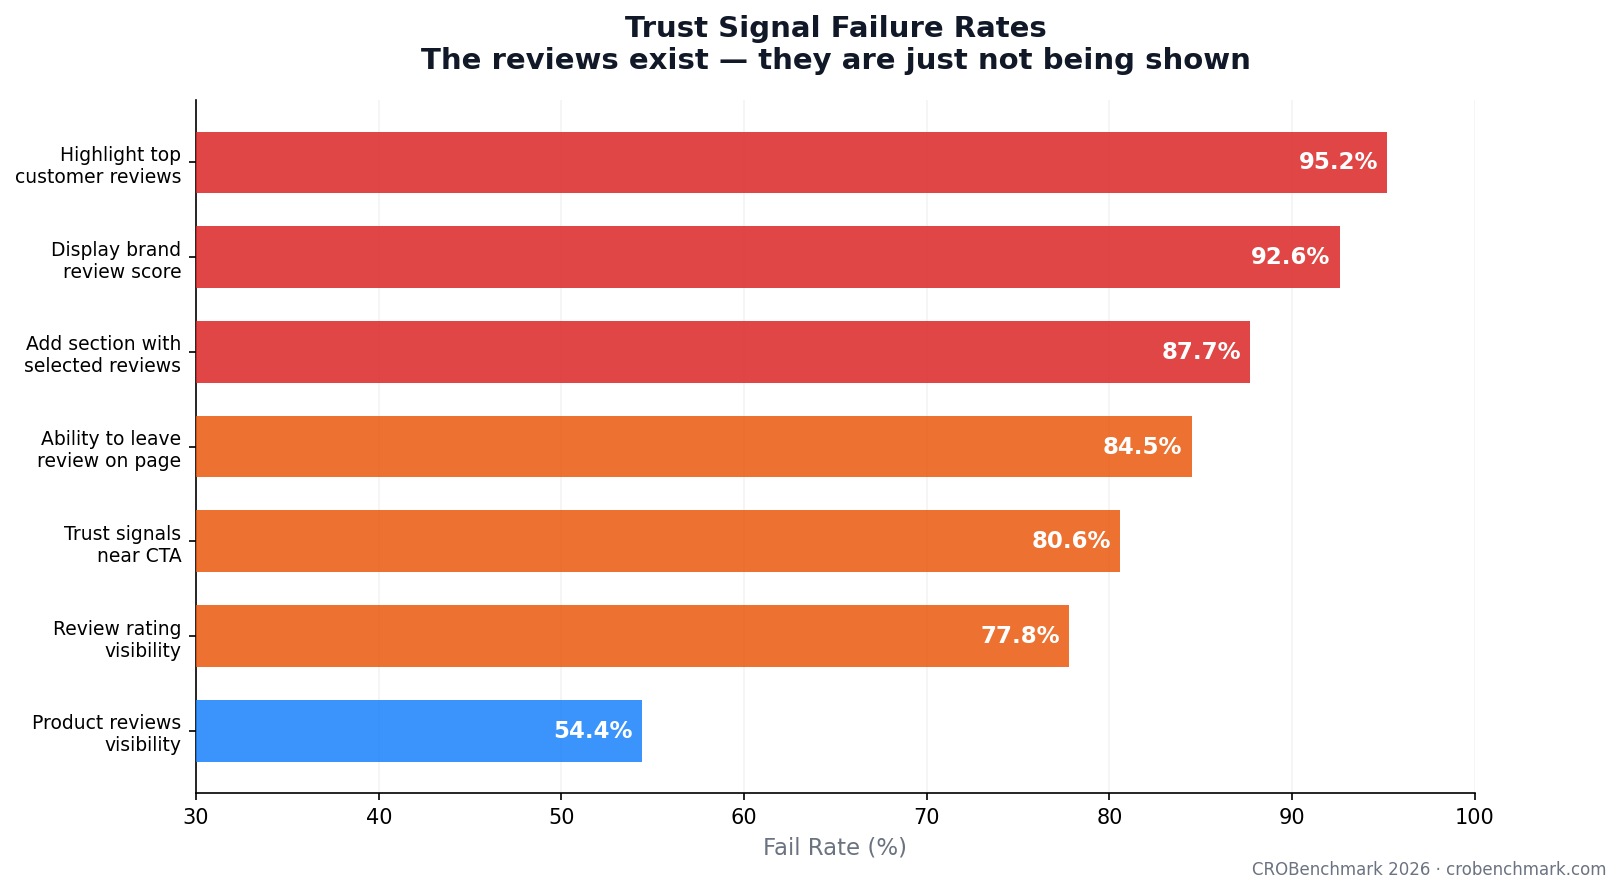
The CROBenchmark 2026 Report is the largest AI-powered eCommerce conversion infrastructure audit published to date - 7,000+ stores evaluated against 300+ criteria across 15+ industries, 8 platforms, and 65 countries. It finds that the rising CAC and declining ROAS reported by brands across every major market are not explained by ad platform changes, agency quality, or market competition. They are explained by broken conversion infrastructure inside the stores themselves: corrupted tracking signals, checkout friction, absent trust signals, and landing pages that show every visitor the same generic experience regardless of which ad brought them there.
Everything you need to publish
Pre-formatted for press - one click to copy
10 standalone charts - right-click to save, or download below
All charts are 150 DPI PNG, suitable for print and digital publication. Attribution line included on every chart. Free to reproduce with attribution to CROBenchmark 2026 / Omniconvert.
Raw data for analysis, citation & publication
| Industry | Stores | CRO Index | Median | Bottom Q | Top Q | Gap | Tracking | Page Speed | Testing |
|---|---|---|---|---|---|---|---|---|---|
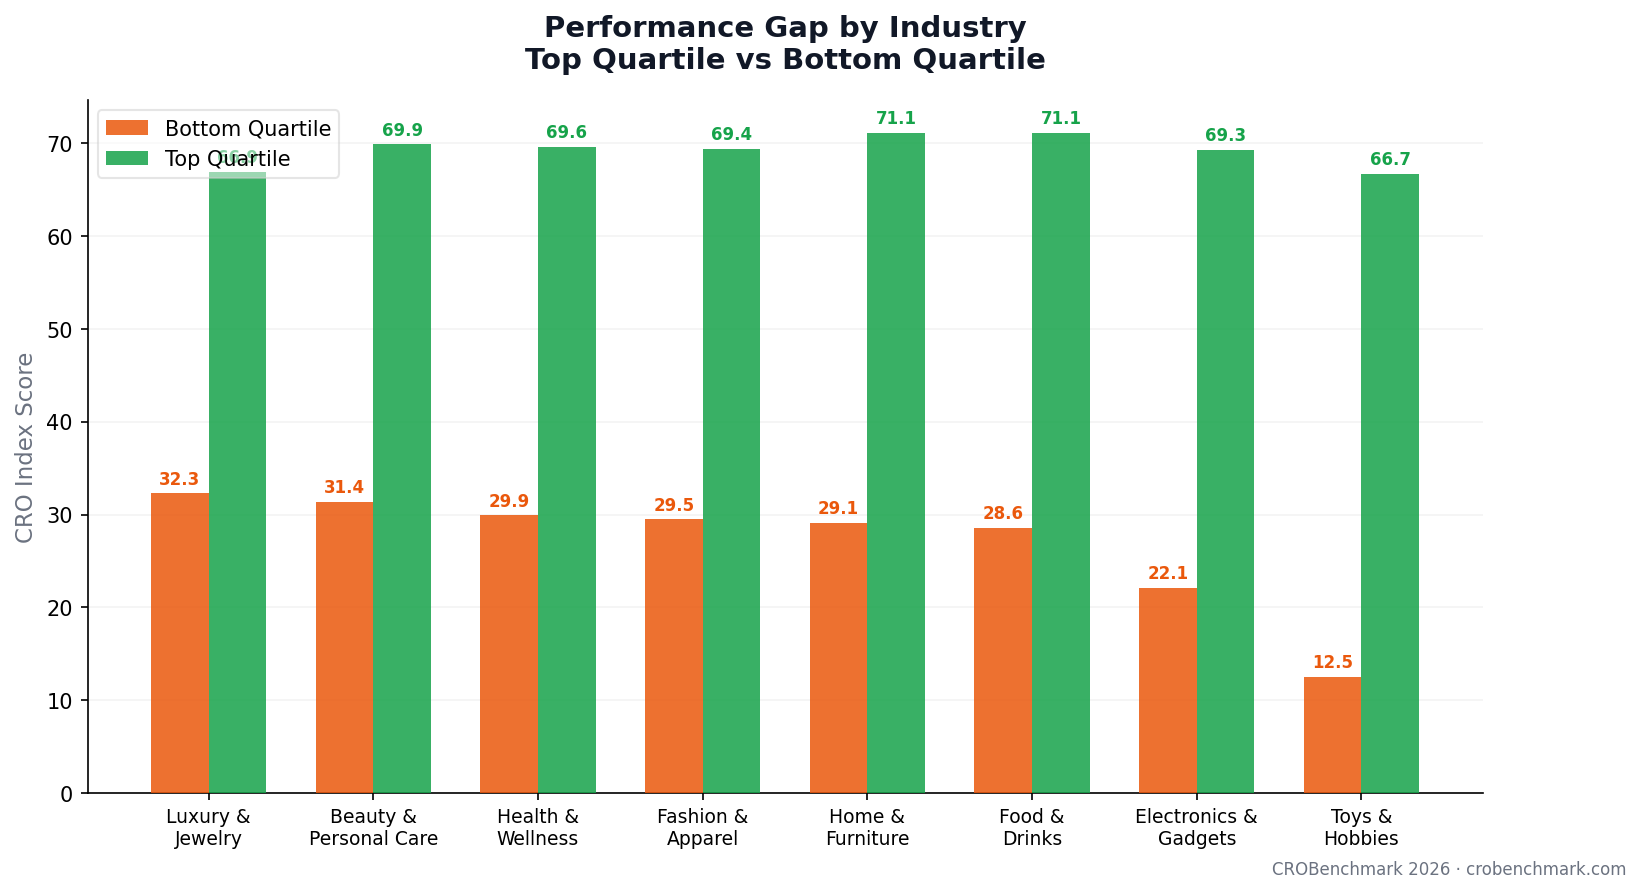
| Home & Furniture | 520 | 54.5 | 59.7 | 29.1 | 71.1 | 42.0 | 29.9 | 40.7 | 26.6 |
| Food & Drinks | 249 | 53.8 | 58.8 | 28.6 | 71.1 | 42.5 | 28.4 | 45.8 | 27.7 |
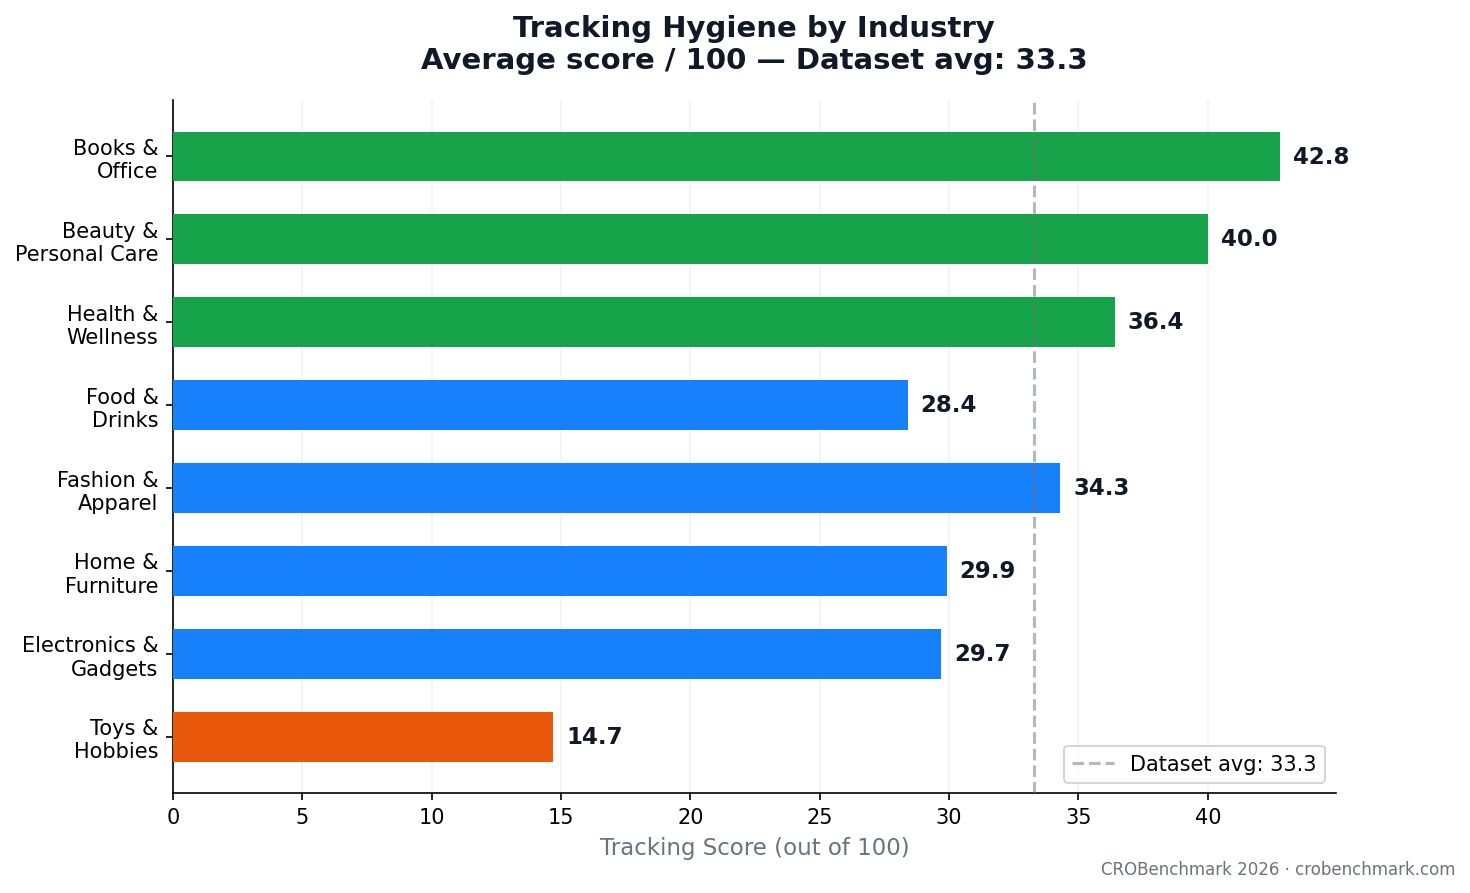
| Beauty & Personal Care | 646 | 53.0 | 55.4 | 31.4 | 69.9 | 38.6 | 40.0 | 21.9 | 26.3 |
| Health & Wellness | 599 | 52.1 | 54.1 | 29.9 | 69.6 | 39.7 | 36.4 | 25.8 | 26.5 |
| Fashion & Apparel | 1,750 | 51.3 | 52.2 | 29.5 | 69.4 | 39.9 | 34.3 | 25.9 | 23.5 |
| Luxury & Jewelry | 448 | 50.8 | 51.8 | 32.3 | 66.9 | 34.6 | 43.0 | 8.7 | 23.0 |
| Electronics & Gadgets | 190 | 50.0 | 54.5 | 22.1 | 69.3 | 47.2 | 29.7 | 41.1 | 28.6 |
| Books & Office Supplies | 713 | 48.6 | - | - | - | - | 42.8 | 1.4 | 22.1 |
| Toys & Hobbies | 185 | 44.3 | 49.1 | 12.5 | 66.7 | 54.2 | 14.7 | 44.7 | 30.3 |
| Travel & Experiences | 77 | 43.8 | - | - | - | - | 23.4 | 43.1 | 24.3 |
All scores out of 100. Bottom Q = average of bottom quartile stores. Top Q = average of top quartile stores. Gap = Top Q minus Bottom Q. Source: CROBenchmark 2026, 7,000+ stores.
| Platform | Stores | Overall CRO | Page Speed | Tracking | A/B Testing |
|---|---|---|---|---|---|
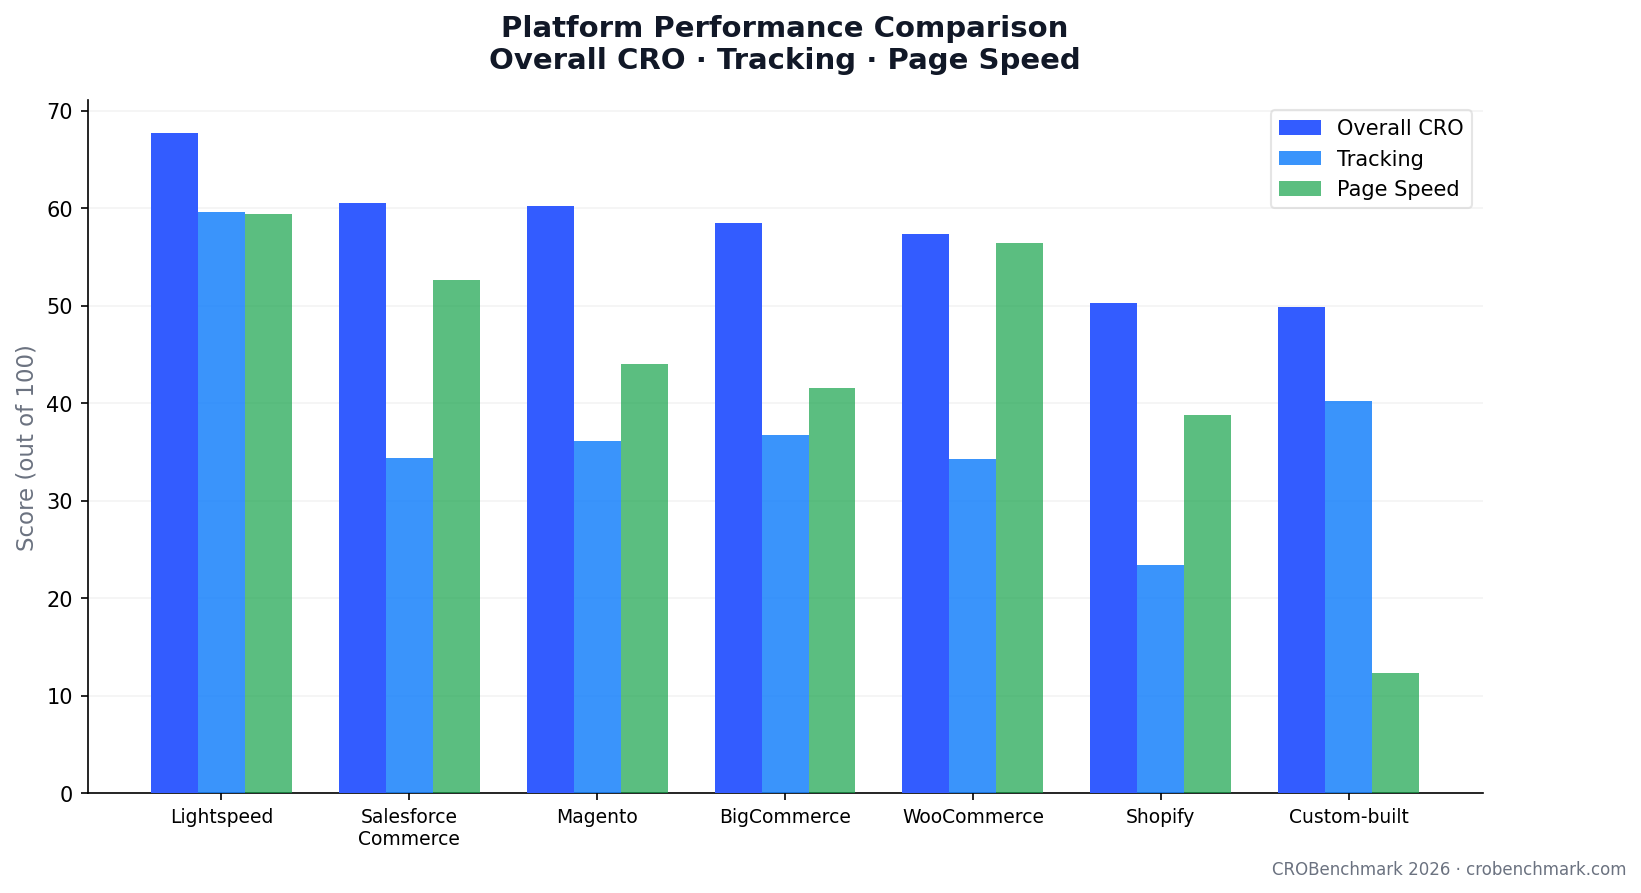
| Lightspeed | 5 | 67.7 | 59.4 | 59.6 | 27.3 |
| Salesforce Commerce | 134 | 60.5 | 52.6 | 34.4 | 25.9 |
| Magento | 181 | 60.2 | 44.0 | 36.1 | 28.6 |
| BigCommerce | 40 | 58.5 | 41.5 | 36.7 | 26.5 |
| WooCommerce | 195 | 57.3 | 56.4 | 34.3 | 25.0 |
| Shopify | 3,161 | 50.3 | 38.8 | 23.4 ⚠ | 27.5 |
| Custom-built / Headless | 3,672 | 49.9 | 12.3 ⚠ | 40.2 | 23.9 |
⚠ Shopify: fastest stores but worst tracking (23.4 avg; 42.4% score zero). ⚠ Custom-built: best tracking but worst page speed (12.3 avg; majority score zero). Source: CROBenchmark 2026.
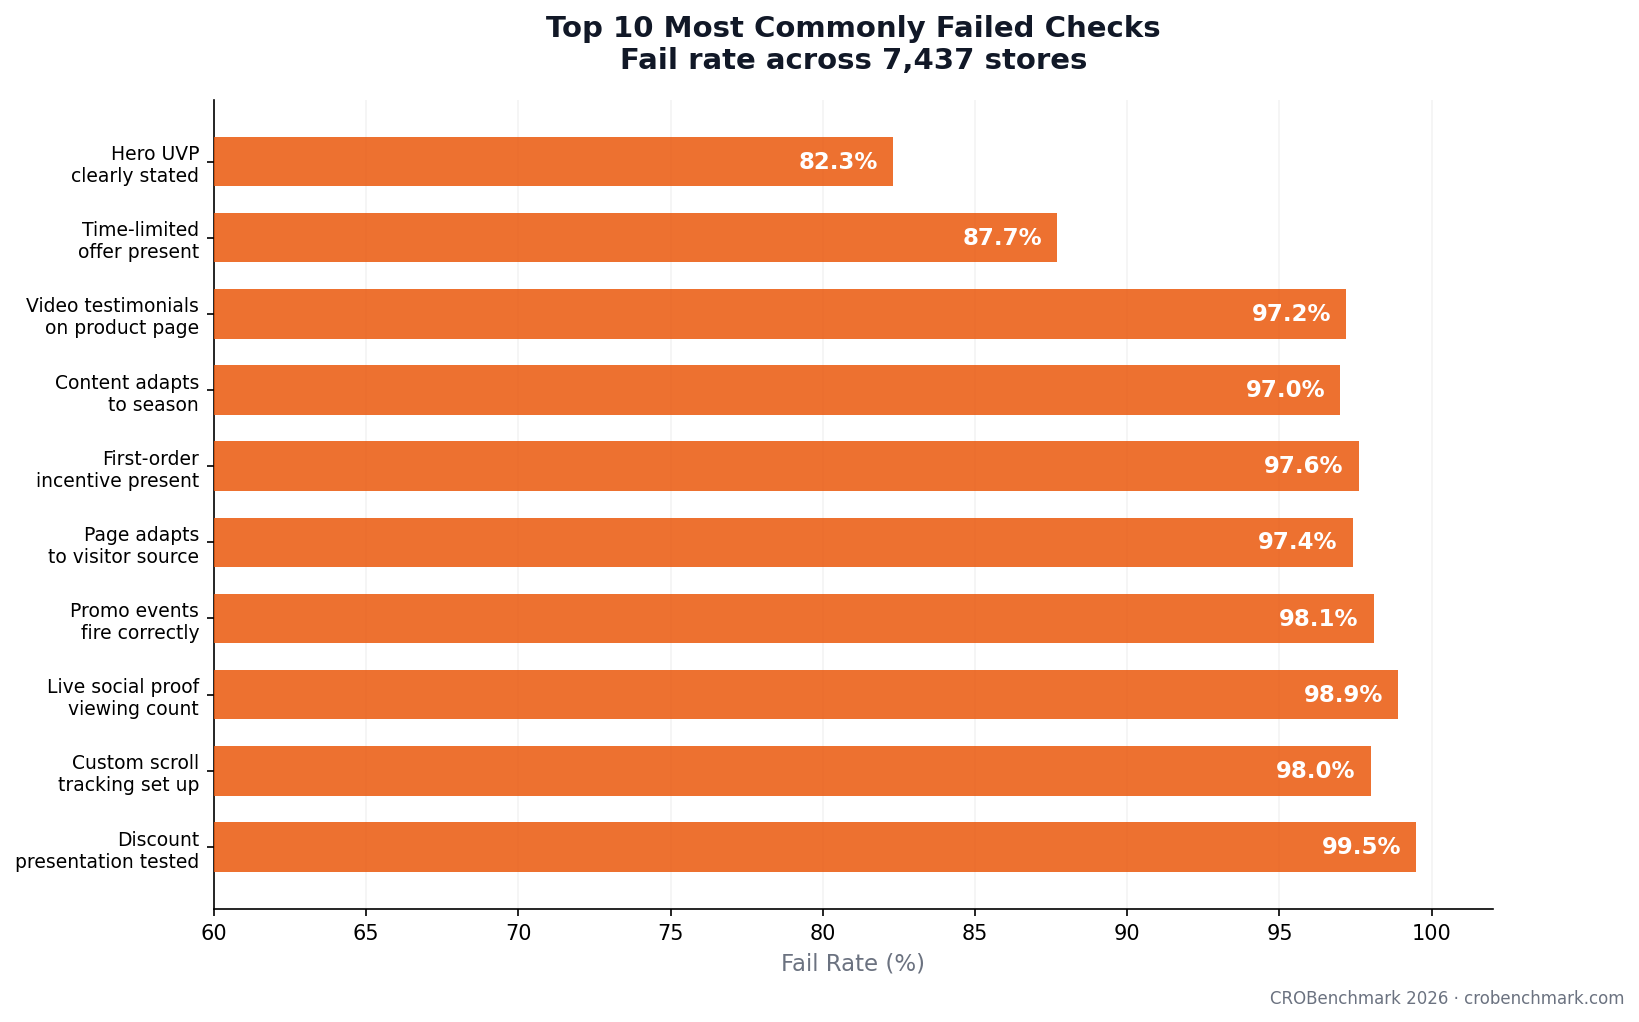
| # | Check | Category | Fail Rate |
|---|---|---|---|
| 1 | Custom scroll tracking is set up | Tracking | 98.0% |
| 2 | Page shows how many people are currently viewing the product | Social Proof | 98.9% |
| 3 | Product promotion events fire when visitors view promoted items | Tracking | 98.1% |
| 4 | Homepage adapts based on which ad the visitor clicked | Personalisation | 97.4% |
| 5 | First-order incentive close to the Buy button | Conversion | 97.6% |
| 6 | Content adapts to weather or seasonal context | Personalisation | 97.0% |
| 7 | Discount presentation has been tested | Testing | 99.5% |
| 8 | Customer video testimonials on the product page | Trust | 97.2% |
| 9 | Hero section clearly states why someone should buy from you | Landing Page | 82.3% |
| 10 | Tracking fires in both head and body of the page | Tracking | 88.2% |
| 11 | Consent mode active before cookie banner appears | Tracking | 84.3% |
| 12 | Add to Cart button stays visible as visitors scroll | UX | 92.3% |
| 13 | Time-limited offer on the page | Conversion | 87.7% |
| 14 | Trust signals appear close to the Buy button | Trust | 80.4% |
| 15 | Feedback tool to ask visitors why they didn't buy | Intelligence | 96.4% |
| 16 | Product analytics shows which items drive loyal customers | Intelligence | 90.9% |
| 17 | Top customer reviews prominently displayed | Trust | 95.2% |
| 18 | Out-of-stock visitors guided to alternatives | UX | 67.8% |
| 19 | Testing tool in place to systematically improve pages | Testing | 80.8% |
| 20 | Data layer tracking all user behaviour is correctly configured | Tracking | 70–82% |
Fail rate = failed / (passed + failed). N/A excluded from denominator. Source: CROBenchmark 2026, 7,000+ stores.
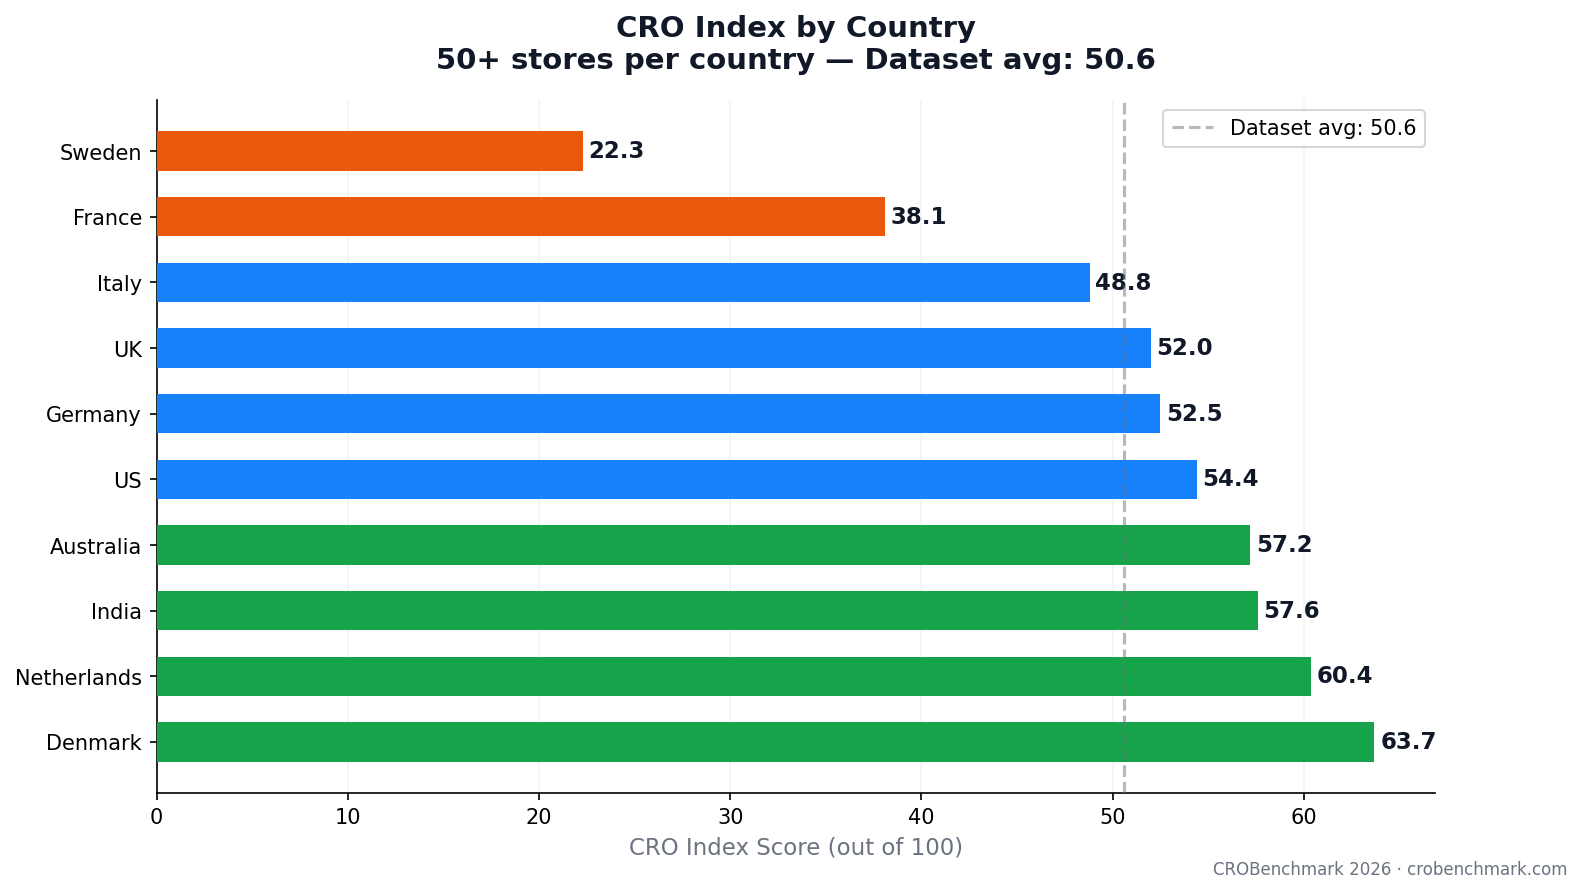
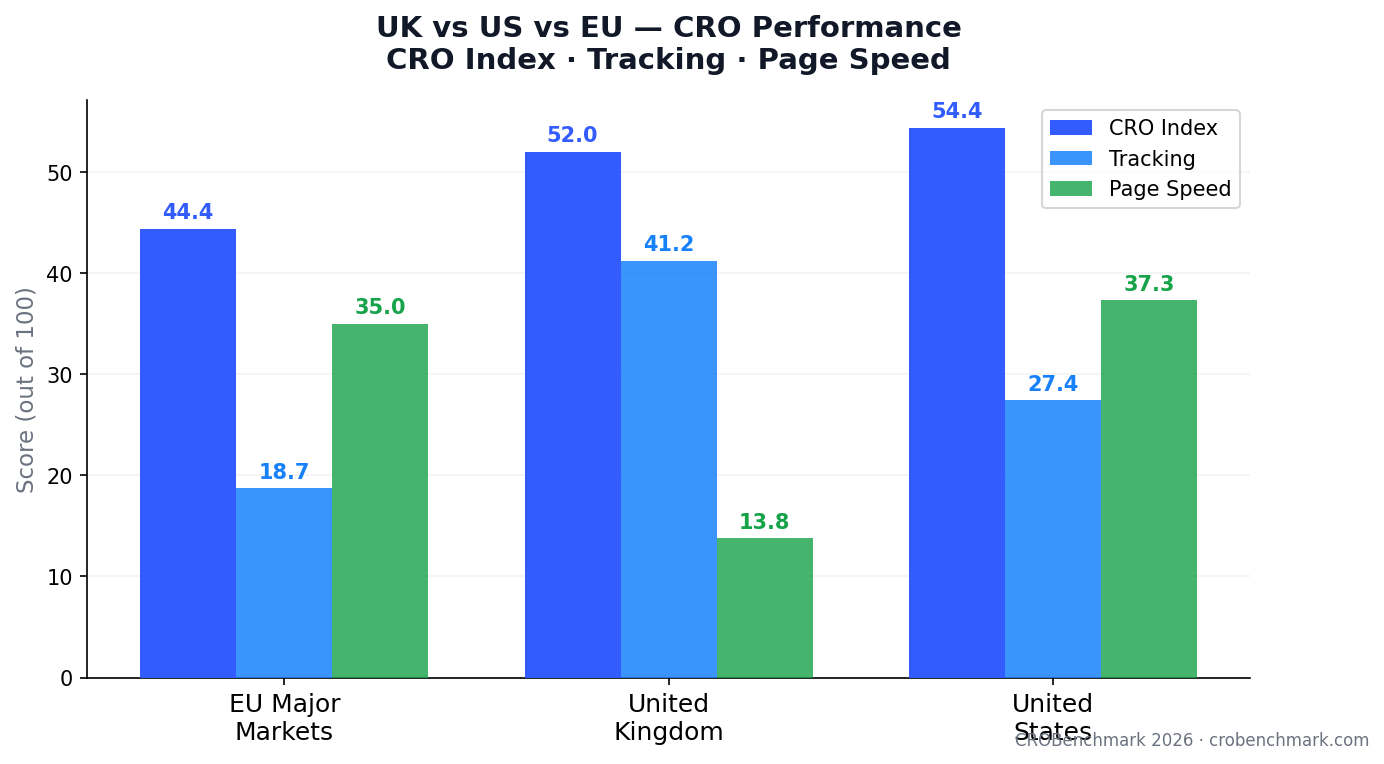
| Country | Stores | CRO Index | Tracking | Page Speed | Notable |
|---|---|---|---|---|---|
| Denmark | 72 | 63.7 | 30.3 | 64.9 | Highest CRO of any major market |
| Netherlands | 84 | 60.4 | 7.2 | 56.0 | Worst tracking of any country |
| India | 105 | 57.6 | 34.3 | 45.5 | Outperforms most European markets |
| Australia | 110 | 57.2 | 38.5 | 32.9 | Above global average on all dimensions |
| United States | 903 | 54.4 | 27.4 | 37.3 | Above avg CRO; weak tracking |
| Germany | 253 | 52.5 | 27.3 | 23.1 | Strong market; below-average speed |
| United Kingdom | 3,328 | 52.0 | 41.2 | 13.8 | Best tracking; worst page speed |
| Italy | 305 | 48.8 | 19.3 | 47.5 | Below average across all dimensions |
| France | 411 | 38.1 | 25.4 | 42.3 | Significantly below EU average |
| Sweden | 291 | 22.3 | 20.7 | 58.8 | Lowest CRO of any major market |
Countries with 50+ stores. EU major markets average: CRO 44.4 · Tracking 18.7 · Page Speed 35.0. Source: CROBenchmark 2026.
For journalists who need to verify credibility before citing
Conflict of interest note: CROBenchmark is an Omniconvert product. Scoring criteria were developed independently of Omniconvert's commercial products. Criteria assess whether a store uses any appropriate tool for a given function - not specifically Omniconvert tools. No store is identified by name in aggregate reporting.
Download full methodology PDF →
Ready-made hooks for journalists & podcast hosts
Press inquiries & bookings
Response within 24h on business days
Response within 24h on business days
Publications that have cited this report
Publication logos will appear here as coverage comes in.
For press kit access, contact valentin@omniconvert.com