
Your AOV Is Below Benchmark: What to Do
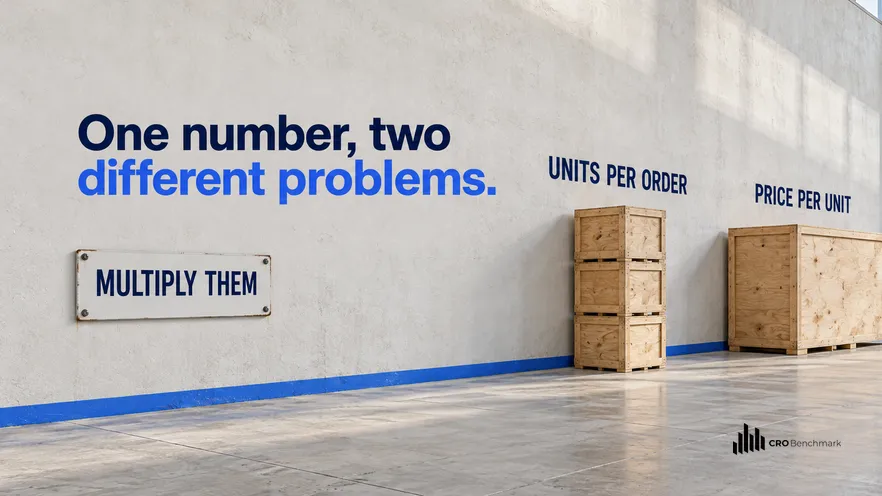
An AOV below benchmark is defined as a mix signal rather than a pricing failure, because average order value is units per order multiplied by price per unit and a category average blends stores with different catalogues, discount habits and basket behaviour. Split your own figure into those two components first. Single-item baskets at a normal price point and normal baskets at a cheap price point are both below the average and need opposite responses. Then measure the share of orders carrying a discount, because a chunk of most gaps is a deliberate promotional strategy. Only then consider interventions, and treat every one of them as a test with conversion rate and contribution margin as guardrails, since most ways of raising AOV reduce the number of orders.
- Split AOV into units per order and price per unit before interpreting any gap.
- A cheap catalogue has a structurally low AOV. No intervention changes that, and none should.
- Restate AOV without discounted orders. Much of the gap is often a choice you made.
- A relevant second item is safer than an upgrade, which reopens a closed decision.
- Every AOV intervention needs conversion rate and contribution margin as guardrail metrics.
An AOV below benchmark is one of the easiest numbers to act on badly, because almost every intervention that raises it also reduces the number of orders. Omniconvert has measured basket and order behaviour across the CROBenchmark dataset of 7,000+ websites in 15+ industries, against 248+ audit criteria, over 13 years in eCommerce, and the stores that raise order value profitably almost all do the decomposition first. The stores that raise it and lose money almost all start with a threshold or an upsell. Last updated: October 2026.
For the companion diagnostic on the other half of the revenue equation, see your conversion rate is below benchmark, and for where the level ought to sit at all, a good conversion rate.
Why an AOV below benchmark is usually a mix signal
Start with the arithmetic, because it makes the rest of the article obvious.
Average order value is units per order multiplied by average price per unit. That is the whole quantity. Any gap against a benchmark is therefore a gap in one of those two components or in both, and the two have almost nothing in common operationally.
A store with 1.1 units per order at a normal price point has a basket-composition problem: people buy one thing and leave. A store with 2.4 units per order and a low price per unit has a catalogue priced where it is priced, which may be exactly right for its market. Both sit below the same benchmark and only one has anything to work on.
The benchmark compounds this by blending catalogues. A category average for home goods includes stores selling candles and stores selling furniture. Being below that average carries almost no information until you know where your price distribution sits inside it.
So the first output of this investigation is not a plan. It is two numbers and a sentence saying which one is low.
The discount question, which usually comes second
This step is quick and it reframes the problem more often than any other.
The calculation is simple: what proportion of orders in the period carried a discount code or sat inside a promotional window, and what was the average depth. Then compute your average order value across undiscounted orders only, and compare that with the benchmark instead.
Two outcomes. If the undiscounted figure sits at or above the category average, you do not have an AOV problem, you have a promotional strategy, and the question is whether the incremental orders it buys cover the margin it gives away. That is a commercial question with a measurable answer.
If the undiscounted figure is still well below, the discounting was not the cause and you are back to the decomposition. Either way the ten minutes is well spent, and it prevents a team from launching a threshold campaign in a store that already discounts heavily, which is a reliable way to confuse two effects.
Statista's tracking of eCommerce promotional behaviour is a reasonable orientation for how normal your discount share is in your category, and the usual finding is that it is higher than the team believes.
The interventions, ranked by how much conversion rate they cost
The ranking here is about interference with the purchase rather than about effect size.
A relevant second item. Offered at the point where the shopper has already committed, a genuinely complementary item adds units per order without touching the original decision. Relevance is the whole condition: an irrelevant suggestion at the cart is friction, and a cart that has become a second storefront converts worse.
Bundles. Effective where the combination is genuinely more useful than the parts, and a transparent price. A bundle that is simply three items with a discount is a discount, and belongs in the previous section.
Free-shipping thresholds. These both raise average order value and reduce order count, and the net depends on the gap between the threshold and your common basket value. Set just above it, shoppers add an item. Set far above it, they abandon. Look at your own basket distribution before choosing a number, and then test it.
Upgrades and premium versions. The most interfering intervention available. A shopper who has chosen a product and is presented with a better one has to make the decision again, and a proportion of them resolve that by leaving. This works in considered categories with real feature differences and costs conversion rate in most others.
The table sets out the four interventions with what each moves, what it risks and the guardrail metric to watch.
| Intervention | What it moves | What it risks | Guardrail to watch |
|---|---|---|---|
| Relevant second item | Units per order | Cart friction if irrelevant | Checkout completion rate |
| Bundle with real utility | Units and price per order | Becomes a discount in disguise | Contribution margin per order |
| Free-shipping threshold | Units per order | Abandonment if set too high | Order count and revenue per session |
| Upgrade or premium version | Price per unit | Reopens a closed decision | Add-to-cart and completion rate |
| Minimum order value | Units per order | Excludes small buyers entirely | New-customer count |
| Removing low-price lines | Price per unit | Loses the entry point to the range | Repeat purchase rate |
The last two rows raise the metric reliably and are the most likely to damage the business, because both work by removing customers rather than by serving them better.
Measuring it so you do not fool yourself
This is where AOV work most often goes wrong, and the mechanism is easy to state.
Average order value is a ratio with order count in the denominator. Anything that removes small orders raises it, including interventions that remove those customers entirely. A threshold that loses a tenth of orders and raises the rest will report a healthy AOV improvement and may have reduced revenue.
The honest primary metric for this work is revenue per session, with contribution margin per order beside it. Both account for the orders you did not get. Where margin varies materially across your catalogue, the margin figure is the one to trust, because a mix shift towards cheaper-to-serve items can raise order value and lower profit.
Run the intervention as a test rather than shipping it. Omniconvert Explore is the CRO platform for that, with A/B and multivariate testing, personalisation, on-site surveys and recordings, and Explore averages a 23.2% conversion uplift across 70,000+ experiments. Bain and Company's work with Reichheld on retention economics, which found that a 5% retention lift can raise profits by 25 to 95 percent, is the reminder that for a store with a structurally low order value the second purchase is usually a larger prize than the first basket.
Baymard Institute's checkout research is worth consulting before adding anything to the cart page, because several of the common AOV interventions are also among the documented causes of abandonment.
What a store owner should do this week
- Decompose the figure. Units per order and average price per unit, for the last ninety days. Write which one is low in a sentence.
- Restate AOV without discounted orders. Ten minutes. If the undiscounted figure is at the benchmark, your problem is a promotional question instead.
- Plot the basket value distribution. Do not choose a free-shipping threshold without it. The common basket value is the only input that matters.
- Get a free audit before adding to the cart. CROBenchmark scores your store against the 248+ criteria behind the dataset, including the cart and checkout criteria an upsell would sit on top of.
- Test with guardrails. Explore runs the intervention against a control with revenue per session as the primary metric. Where order, margin and basket data sit apart and have to be assembled before any of this can be computed, Nexus by Omniconvert unifies that data and ranks the next actions by True Profit, with a person approving what goes live.
FAQ: an average order value below benchmark
Why is my average order value below benchmark?
Usually because of what you sell and how it is bought rather than because of anything on the site. Average order value is units per order multiplied by price per unit, and a category benchmark blends stores with different catalogues, different discount habits and different basket behaviour. Split your figure into its two parts before interpreting the gap. A store with single-item baskets and a store with a cheap catalogue are both below the average for reasons that need opposite responses.
Is a low AOV actually a problem?
Only if it makes your unit economics not work, which is a different question from whether it is below an average. A low order value with a high repeat rate and healthy contribution margin is a perfectly good business, and some categories are built that way. The figure that decides whether you have a problem is contribution margin per order against the cost of acquiring it, not the comparison with a published benchmark.
What is the safest way to raise AOV?
A genuinely relevant second item, offered where the shopper is already committed. It is safer than persuading somebody to buy a more expensive version of what they came for, because it does not interfere with the decision they have already made. Upgrades work in some categories and reliably cost conversion rate in others, since introducing a more expensive option during a purchase reopens a decision the shopper had closed.
Do free-shipping thresholds work?
They move average order value and they also move the number of orders, often in opposite directions, so the result depends entirely on where the threshold sits relative to your basket distribution. Set just above the common basket it adds an item. Set far above it, shoppers abandon rather than add. The only way to know is to look at your own distribution and then test the threshold with conversion rate as a guardrail.
Should I stop discounting to raise AOV?
Measure the discount share first, then decide, because in many stores a large part of the AOV gap is a deliberate promotional strategy rather than a shortfall. Work out the share of orders carrying a discount and the average depth, and restate your AOV without them. If the undiscounted figure sits at or above the benchmark, you are choosing a lower order value in exchange for volume, and the question becomes whether that trade is still profitable.
The bottom line
Average order value is the metric most often raised at the expense of the business. It is a ratio with order count underneath it, so anything that removes small orders improves it, and several popular interventions work exactly that way. The sequence that protects you is short. Decompose the figure into units per order and price per unit, so you know which half is actually low. Restate it without discounted orders, because a good share of most gaps turns out to be a promotional choice already made deliberately. Plot your basket distribution before picking any threshold. Then move one thing, with revenue per session as the primary metric and contribution margin beside it, and accept the result even when average order value went the way you wanted and profit did not.