
How Traffic Quality Skews Your Conversion Rate
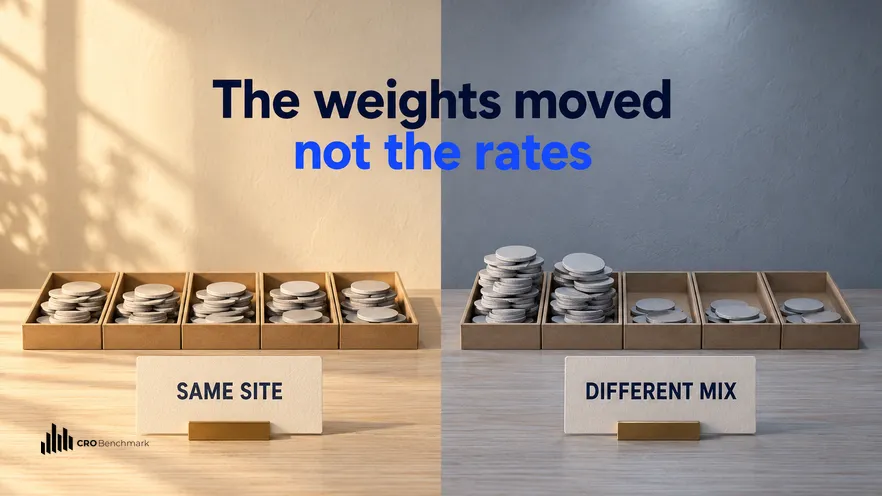
A mix shift is defined as a change in the composition of incoming traffic across segments that convert at different rates, which moves the blended conversion rate even when every individual segment converts exactly as before. Traffic quality skews a conversion rate through that mechanism, and it routinely produces larger movements than site changes do. Omniconvert has run 70,000+ experiments across 2,500+ Shopify stores over 13 years in eCommerce [CROBenchmark Report 2026, Omniconvert], and composition is the most common explanation for a movement nobody can attribute. This piece covers which shifts matter, how to separate a mix shift from a real change, and what to report instead.
- Compare the same segments across periods rather than the blended totals.
- Watch five shares: brand search, returning visitors, device, geography, paid prospecting.
- Treat a movement with no segment-level change as a traffic event, not a site event.
- Expect invalid traffic to lower the rate asymmetrically, in spikes rather than evenly.
- Report the blended rate with its mix beside it, never on its own.
- Compare composition before comparing a conversion rate to any benchmark.
- Pause a test rather than read it through a composition change on the same surface.
Omniconvert has measured conversion performance against the CROBenchmark dataset of 7,000+ websites in 15+ industries, across 248+ audit criteria, over 13 years in eCommerce [CROBenchmark Report 2026, Omniconvert]. One pattern recurs in every category: a team investigating a conversion drop looks for a site cause, finds something plausible, fixes it, and the number returns a month later for reasons that had nothing to do with the fix.
How traffic quality skews your conversion rate, mechanically
Start with the arithmetic, because the intuition is weak here. A blended conversion rate is a weighted average of segment rates, weighted by session share. Two things can move it: a segment rate, or a segment weight. Only the first is about your site.
The second moves constantly and mostly without a decision. A prospecting campaign starts and adds cold sessions. A brand campaign ends and removes warm ones. A seasonal peak brings a different device mix. An affiliate switches on. Each of those changes the weights, and each will be reported as a change in performance.
That is why the blended number is the wrong place to start an investigation. It is a true summary and a poor diagnostic, and the gap between those two things is where a quarter of misdirected work comes from.
The five shares worth watching
Of the five, brand against non-brand search is usually the largest. Someone searching for your name has already decided most of the question, and someone searching for a category has not, so a shift between those two populations moves the blended rate substantially while both groups behave exactly as they always did.
Returning against new runs it close, and it is the one most often mistaken for a site improvement. A loyalty push or an email send raises the returning share for a fortnight, the conversion rate rises, and the credit goes to whatever was shipped that week.
Invalid traffic is the asymmetric member of the group. Automated sessions add denominators and no orders, so they can only push the reported rate down, and they usually arrive in concentrated spikes. A single-day collapse with no segment explanation is worth checking for that before anything else. The cross-store version of this argument is in why two stores with the same CVR are not equal.
Mix-Constant Comparison: the check that settles it
Mix-constant comparison is defined as evaluating two periods by comparing each segment's own conversion rate rather than the blended totals, so that a change in composition cannot be mistaken for a change in performance.
The procedure takes an hour. Split both periods by the five shares. For each segment, record its session share and its conversion rate in both periods. Then read the two columns: shares that moved, and rates that moved. Almost always one of those columns is nearly flat, and whichever one it is tells you what happened.
| Shift | Effect on the blended rate | Usual cause |
|---|---|---|
| More non-brand search | Down | Category campaign or ranking gain |
| More returning visitors | Up | Email send or loyalty push |
| More mobile share | Usually down | Social or seasonal peak |
| New geography added | Either, often down | Market expansion or shipping change |
| More paid prospecting | Down | Budget shifted up the funnel |
| Invalid traffic spike | Down only | Automated sessions, no orders |
The way teams lose a quarter to this is by investigating a drop with a site hypothesis already in mind. Somebody notices the conversion rate fell the week after a product-page release, concludes the release caused it, rolls part of it back, and the number recovers a fortnight later when the prospecting campaign that actually caused it finished. The release is now permanently believed to have been harmful, and the next one gets blocked. The order of operations is the whole fix: segment first, then hypothesise.
What to report instead of a bare conversion rate
This is a reporting change rather than an analytics project. Put the blended rate at the top, and immediately under it the five session shares for the same period and the period before. Anybody reading it can then see for themselves whether the movement has a composition explanation.
It also changes how benchmarks are read. Unexpected cost and unclear information have been among the leading reasons shoppers abandon purchases for as long as Baymard Institute has measured it, at around 70% average cart abandonment [Baymard Institute, 2025], and that is an average over a mix that is not yours. Comparing your blended rate to a category figure without comparing composition first is the most common misuse of a benchmark there is, which why industry averages mislead covers in detail.
There is a testing consequence too, and it is strict. A composition change on the surface a test is running on invalidates the test for the overlapping period. Omniconvert Explore averages a 23.2% conversion uplift across 70,000+ experiments, and results of that quality come from programmes that pause a test rather than read it through a traffic event.
AliveCor used Omniconvert to run a structured A/B testing programme and achieved +21% conversion rate, +5% revenue per visitor, and 94% statistical relevance across their experiments. [Omniconvert, AliveCor case study] The third figure matters here: statistical relevance is what distinguishes a result from a coincidence, and a mix shift during a test is one of the most common ways a coincidence gets mistaken for a win.
What to do this week
- Pull the five shares. For this month and last. Brand, returning, device, geography, paid prospecting.
- Run a mix-constant comparison. Segment rates in both periods. Read which column actually moved.
- Check for invalid traffic. Look for single-day session spikes with no order movement at all.
- Add the mix to the report. One number with five shares under it, permanently.
Measure against a current baseline rather than an assumption: the free CROBenchmark audit scores your store against the 248 criteria and shows where the gaps sit, and Omniconvert Explore is the CRO platform for proving a fix with A/B and multivariate testing, segmentation and session recordings, which is the only way to settle a site hypothesis once composition is ruled out. For turning a confirmed gap into work, see how to build a benchmark-driven test roadmap, and for explaining one of these movements upwards, how to explain a CVR drop to your boss. Further upstream, Omniconvert Commander (formerly Nexus) is an AI for eCommerce growth engine that unifies commerce data, prioritises experiments by True Profit, and generates campaigns and creative you approve before they go live. For reading a category figure without being misled, how to read an industry benchmark is the companion piece.
Also worth reading alongside this: seasonality and benchmarks.
Frequently asked questions
How does traffic quality skew your conversion rate?
Through composition. Segments convert at very different rates, so changing the proportions moves the blended number even when every segment performs identically. A month with more cold prospecting traffic and less returning-visitor traffic reports a lower conversion rate from an unchanged site.
Which composition shifts matter most?
Brand against non-brand search, returning against new visitors, device mix, geography, and the share of paid prospecting. Those five account for most unexplained movement, and all five change without anybody deciding to change them, usually because a campaign started or ended.
How do I tell a mix shift from a real change?
Compare the same segments across both periods rather than the blended totals. If every segment holds its rate and only the proportions moved, the site did not change. If a segment moved on its own, that is where the real change is, and it is usually a much smaller story than the blended number suggested.
Does invalid traffic affect this?
Yes, and asymmetrically, because it adds sessions and no orders. A burst of automated traffic lowers the reported conversion rate without touching any real behaviour, and it tends to arrive in concentrated spikes rather than evenly, which makes it look like a sudden site problem.
Should I report a blended conversion rate at all?
Report it with its mix alongside. A blended rate on its own invites a wrong explanation, and the same number with the five composition shares beside it usually explains itself. Leadership does not need fewer numbers here, it needs the one number plus the context that makes it readable.
How does this affect benchmark comparison?
It is the main reason two stores with the same category benchmark are not comparable. A store with a large returning-customer base and one running mostly cold acquisition will differ by more than any site quality gap, so compare composition first and the conversion rate second.
Segment before you hypothesise
The next time the conversion rate moves and nobody can say why, resist the first plausible site explanation and spend an hour splitting both periods by brand share, returning share, device, geography and paid prospecting share. Then look at which column moved: the weights or the rates. One of them will be nearly flat.
If it was the weights, you have a traffic event and no site work to do. If a segment rate moved on its own, you have a much narrower and far more useful problem than the blended number implied, and that is the one worth taking to a test.