
How to Raise Your Average Order Value
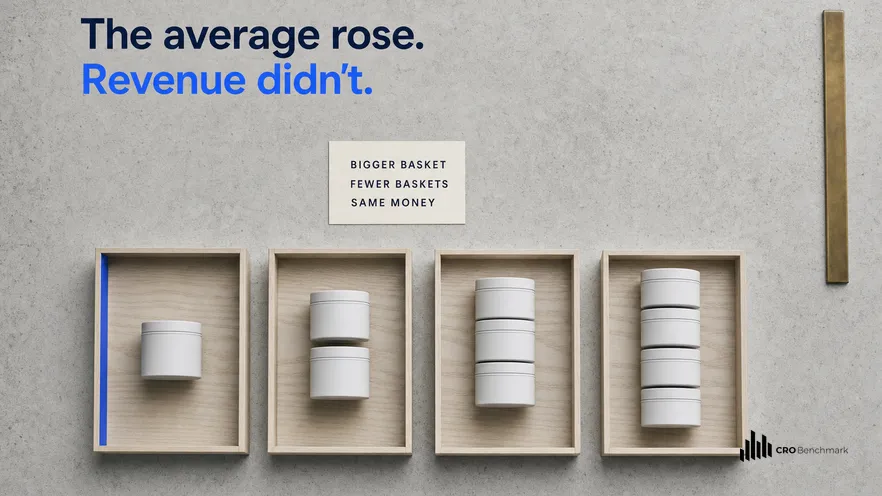
Raise average order value by working four rungs in order of risk: first remove the reasons shoppers buy less than they intended, then make the larger option easy to choose, then recommend things that genuinely go together, and only last apply thresholds and volume offers. The order matters because the first rung adds no friction and the last one changes the price of entry. Judge every change on revenue per visitor rather than on average order value, or a rise funded entirely by lost conversions will read as a win.
- Average order value can rise while revenue falls, so revenue per visitor is the metric that decides.
- Most baskets are small because information was missing, not because the offer was.
- A bundle chosen before commitment outperforms an upsell shown after it.
- Free-shipping thresholds move the average reliably and revenue unreliably.
- Run basket tests past the returns window, because persuaded items come back most.
Average order value is total revenue divided by number of orders, and it is the easiest conversion metric to move in the wrong direction while appearing to succeed. Push a free-shipping threshold high enough and the average will rise on Monday. Whether you made money depends on how many shoppers quietly left instead, and that number does not appear anywhere in an average order value report. Last updated: August 2026.
Omniconvert has measured basket behaviour across the CROBenchmark dataset of 7,000+ websites in 15+ industries, against 248+ audit criteria, over 13 years in eCommerce, and the finding that matters most is unglamorous: on the majority of stores, small baskets are an information problem before they are an offer problem. Shoppers who would have bought two took one because they could not confirm something about the second, and no discount fixes that.
This guide sets out four levers ordered by the risk each carries to your conversion rate, why that ordering is the whole discipline, and how to measure any of it without fooling yourself. If the rate itself is the problem rather than the basket, start with a good conversion rate instead.
Why average order value is the easiest metric to fake
Work the arithmetic once and it stays with you. A store takes a hundred orders averaging fifty. It introduces a threshold that pushes twenty shoppers to add an item, taking those to seventy, and drives fifteen others away entirely. Orders fall to eighty-five, average order value rises to about fifty-four, and total revenue has gone down. Every dashboard tracking the average shows a clear improvement.
This is not a hypothetical failure mode, it is the standard one, and it survives because the shoppers who left are not counted anywhere in the metric they affected. They appear only in conversion rate, which is usually owned by a different report and often by a different person.
The defence is to make revenue per visitor the decision metric for anything touching the basket. It is conversion rate multiplied by average order value, so it cannot be improved by trading one against the other. Any intervention that raises average order value and lowers revenue per visitor has cost money, and you want to find that out in a test rather than in a quarterly review.
Rung one: remove the reasons people buy less
Start with the second item a shopper considered and did not take. On most stores the reason is not price. It is that adding it raised a question the page did not answer: whether it ships together, whether it can be returned separately, whether it actually fits the first item, whether the variant they chose for one applies to the other.
Shipping consequence is the most common and the most fixable. A shopper who cannot tell whether a second item delays delivery will often drop it rather than risk the first one arriving late. Stating the shipping outcome at the point of adding, rather than at checkout, removes that hesitation entirely and costs a line of copy.
Returns terms matter more here than most teams expect. Baymard Institute has documented for years that roughly seventy percent of carts are abandoned, with unclear terms and unexpected costs among the reliable causes [Baymard Institute, 2026]. A returns policy that reads as though sending back one item of three is difficult will suppress the third item on every order, silently and permanently.
Rung two: make the larger option easy to choose
The mechanism is presentation rather than incentive. A shopper looking at a single unit does not spontaneously wonder whether a three-pack exists. Shown the two side by side with the per-unit difference visible, a meaningful share choose the larger one, and they do so before any commitment has been made, which is why this rung costs almost nothing in conversion.
Two design details decide whether it works. The options need to be genuinely comparable, so the same variant selection carries across rather than resetting. And the larger option needs a stated reason to exist beyond price: it lasts a season, it covers two rooms, it saves a reorder. A per-unit saving alone reads as an attempt to move stock.
Subscription and refill options belong on this rung too, presented as a purchase choice rather than as a commitment. Marketing Metrics has long put the probability of selling to an existing customer at roughly sixty to seventy percent against five to twenty percent for a new prospect, which is exactly why a refill choice offered at the first purchase is worth more than its immediate basket effect [Marketing Metrics].
Rung three: recommend what genuinely goes together
The distinction is easier than it sounds. A complement solves something the first product introduces: the thing it needs to work, the thing that protects it, the thing that runs out. A related product merely resembles it, which is useful for browsing and useless in a basket, because a shopper who has chosen one rarely wants a near-identical second.
Most recommenders default to similarity because it is the easier signal and it performs well on click-through. Click-through is the wrong objective here: a shopper who clicks a similar product has been sent backwards into comparison, and the frequent result is a smaller basket or none, arriving in the report as engagement.
Placement decides the rest. A complement offered on the product page reads as helpful. The same complement injected between the cart and the payment step reads as an obstacle, because at that point the shopper has decided and wants to finish. If you test one thing on this rung, test moving the offer earlier rather than changing what it offers.
Rung four: thresholds and volume offers, last
| Lever | Risk to conversion rate | Where it fails | Measure on |
|---|---|---|---|
| Answer the second-item question | None | Rarely, it removes friction | Revenue per visitor |
| State shipping consequence early | None | Rarely | Revenue per visitor |
| Show multipack as a comparison | Very low | When variants reset between options | Revenue per visitor |
| Offer a refill or subscription choice | Low | When framed as a commitment | Revenue per visitor and repeat rate |
| Recommend a true complement | Moderate | When it is similarity, not complement | Revenue per visitor |
| Post-cart upsell | High | Interrupts a decided shopper | Revenue per visitor and completion rate |
| Free-shipping threshold | High | Set above the natural basket | Revenue per visitor against a holdout |
| Volume discount | High | Funds itself from existing large orders | Margin per visitor |
The volume-discount row is the one worth pausing on. A discount applied at a quantity many shoppers already reach pays out on orders that would have happened anyway, so it can raise average order value slightly while reducing margin substantially. That is invisible on any revenue metric and shows up only when someone checks margin per visitor.
For a threshold specifically, set it from your own basket distribution rather than from a round number. A threshold a little above the common basket pulls shoppers up. One set well above it converts a portion of your customers into non-customers, and the average rises because they are gone.
What to do this week
- Plot the basket distribution, not the average. Most stores find a large single-item spike they had not quantified, and that spike is the whole opportunity.
- Read your product page as a shopper adding a second item. Write down every question it does not answer. That list is rung one and it is usually free.
- Switch your dashboards to revenue per visitor for anything basket-related, before you run a single test.
- Check your threshold against the distribution. If it sits well above the common basket, you are probably buying the average with lost orders.
- Run a free audit to see which of these is actually costing you: the CROBenchmark free audit scores the funnel against 248+ criteria and tells you where the basket problem is, if it is one.
Where the questions the audit raises need settling rather than debating, Omniconvert Explore is the CRO platform that pairs heatmaps, recordings and surveys with the A/B test that resolves them, averaging a 23.2% conversion uplift across 70,000+ experiments. Where the constraint becomes deciding which of many findings to work first, Nexus by Omniconvert is an AI for eCommerce growth engine that unifies commerce data, ranks experiments by True Profit, and generates campaigns and creative you approve before they go live. If the prior question is whether your funnel is sound at all, our companion guide on how to audit it covers the method.
What raising average order value cannot do
It cannot fix margin. A basket grown with discounted units can carry more revenue and less profit than the basket it replaced, and stores that report on revenue alone find this out late. Check margin per visitor alongside revenue per visitor whenever a discount is involved.
It cannot create demand. If the constraint is that too few qualified visitors arrive, basket work optimises a small number and the gain is bounded by that number. Acquisition and retention both have more room in that situation, and both are harder conversations.
And it cannot survive a returns problem. Items added under persuasion are returned at higher rates than items chosen unprompted, so a basket programme measured at purchase will overstate itself. Extend the measurement window past the returns period. A store that raised average order value by twelve percent at checkout and gave back nine of it in returns has done a great deal of work for three percent, and will not know unless it looked.
The bottom line
Work the ladder in order and measure on revenue per visitor. The first two rungs, answering the questions that stop a shopper taking a second item and making the larger option easy to choose, carry almost no conversion risk and are where most of the recoverable value sits on a typical store. Recommendations pay when they solve a problem the first product creates and cost when they are similarity in disguise. Thresholds and volume discounts work, and they belong last because they change the price of entry, which means they can lift your average by removing the customers who would have bought least. Plot your basket distribution before you touch any of it, extend the measurement past the returns window, and keep a holdout. A store that raises revenue per visitor by four percent has done better than one that raised average order value by fifteen and never checked what it cost.